Global overview
A series of graphs that gives us a general overview of plastic challenge
These graphs provide a global overview of plastics production, waste, and pollution of our oceans. They are designed to provide a summary of the plastics challenge and what this tells us about how to address it.
A more detailed exploration of this topic can be found at www.ourworldindata.com
In the chart above we see the evolution of annual global plastic production, measured in tonnes per year. This is shown from 1950 through to 2015. In 1950 the world produced only 2 million tonnes per year. Since then, annual production has increased by nearly 200 times, reaching 381 million tonnes in 2015. For context, this is roughly equivalent to the mass of two-thirds of the world population.
The short downturn in annual production in 2009 and 2010 was predominantly the result of the 2008 global financial crisis.
In the chart above we see plastic production allocation by sector for 2015.
Packaging was the dominant use of primary plastics, with 42 percent of plastics entering the use phase. Building and construction was the second largest sector utilizing 19 percent of the total. Primary plastic production does not directly reflect plastic waste generation since this is also influenced by the polymer type and lifetime of the end product.
In the chart above we see the total plastic waste generation by country, measured in tonnes per year. This, therefore, takes account of per capita waste generation and population size. This estimate is available only for the year 2010, but as we see later in this entry, the relative global picture is similar in projections to 2025.
With the largest population, China produced the largest quantity of plastic, at nearly 60 million tonnes. This was followed by the United States at 38 million, Germany at 14.5 million and Brazil at 12 million tonnes.
Like the per capita figures above, note that these figures represent total plastic waste generation and do not account for differences in waste management, recycling or incineration. They, therefore, do not represent quantities of plastic at risk of loss to the ocean or other waterways.
Beyond domestic plastic waste generation, there is also a large global commodity market for recycled plastic waste.
In the chart above we see the per capita rate of plastic waste generation, measured in kilograms per person per day. Here we see differences of around an order of magnitude: daily per capita plastic waste across the highest countries – Kuwait, Guyana, Germany, Netherlands, Ireland, the United States – is more than ten times higher than across many countries such as India, Tanzania, Mozambique, and Bangladesh.
Note that these figures represent total plastic waste generation and do not account for differences in waste management, recycling or incineration. They, therefore, do not represent quantities of plastic at risk of loss to the ocean or other waterways.
Inadequately disposed waste is that which has the intention of being managed through waste collection or storage sites, but is ultimately not formally or sufficiently managed. This includes disposal in dumps or open, uncontrolled landfills; this means the material is not fully contained and can be lost to the surrounding environment. This makes it at risk of leakage and transport to the natural environment and oceans via waterways, winds, and tides.
In the world map above we see estimates on the share of plastic waste that is defined as inadequately managed and therefore at risk of entering the oceans and other environments. We see very large differences in the effectiveness of waste management across the world: high-income countries, including most of Europe, North America, Australia, New Zealand, Japan and South Korea have very effective waste management infrastructure and systems; this means discarded plastic waste (even that which is not recycled or incinerated) is stored in secure, closed landfills. Across such countries, almost no plastic waste is considered inadequately managed. Note this does not mean there is no plastic at risk of entering the natural environment — see the section on littering below. Across many low-to-middle-income income countries, inadequately disposed waste can be high; across many countries in South Asia and Sub-Saharan Africa, between 80-90 percent of plastic waste is inadequately disposed of, and therefore at risk of polluting rivers and oceans. This is strongly reflected in the global distribution of mismanaged waste and inputs from river systems.
In the chart above we see the share of global plastic waste that is discarded, recycled or incinerated from 1980 through to 2015.
Prior to 1980, recycling and incineration of plastic was negligible; 100 percent was therefore discarded. From 1980 for incineration, and 1990 for recycling, rates increased on average by about 0.7 percent per year. In 2015, an estimated 55 percent of global plastic waste was discarded, 25 percent was incinerated, and 20 percent recycled.
If we extrapolate historical trends through to 2050 — as can be seen in the chart here — by 2050, incineration rates would increase to 50 percent; recycling to 44 percent; and discarded waste would fall to 6 percent. However, note that this is based on the simplistic extrapolation of historic trends and does not represent concrete projections.
In the chart above we see river plastic inputs to the ocean aggregated by region — this is given as a share of the global total. Here we see a clear dominance of river plastic inputs from Asia, which represents 86 percent of the global total. This is followed by Africa at 7.8 percent, and South America at 4.8 percent. Collectively, Central & North America, Europe, and the Australia-Pacific region account for just over one percent of the world total.
Plastic enters the oceans from coastlines, rivers, tides, and marine sources. But once it is there, where does it go?
The distribution and accumulation of ocean plastics is strongly influenced by oceanic surface currents and wind patterns. Plastics are typically buoyant – meaning they float on the ocean surface –, allowing them to be transported by the prevalent wind and surface current routes. As a result, plastics tend to accumulate in oceanic gyres, with high concentrations of plastics at the centre of ocean basins, and much less around the perimeters. After entry to oceans from coastal regions, plastics tend to migrate towards the centre of ocean basins.
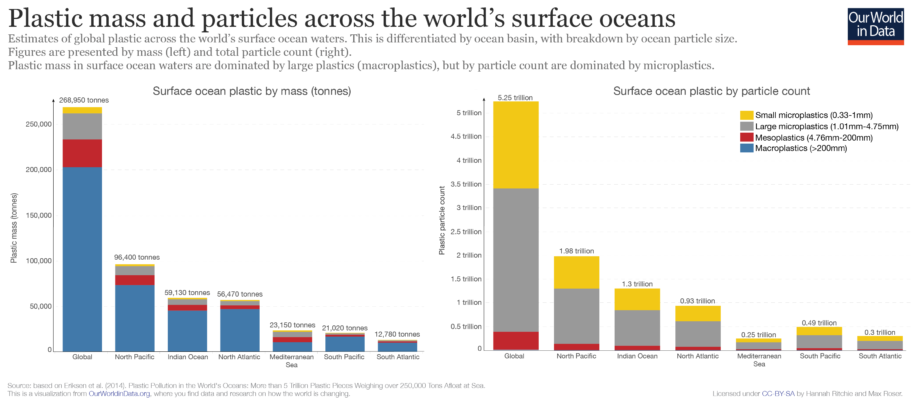
It’s estimated that there are more than 5 trillion plastic particles in the world’s surface waters. We can see this breakdown of plastic particles by ocean basin here. The accumulation of a large number of particles tends to result from the breakdown of larger plastics — this results in an accumulation of plastic particles for a given mass.
The figure above summarises plastics in the ocean surface waters by basin. This is shown by particle size in terms of mass (left) and particle count (right). As shown, the majority of plastics by mass are large particles (macroplastics), whereas the majority in terms of particle count are microplastics (small particles).
The most well-known example of large plastic accumulations in surface waters is the so-called ‘Great Pacific Garbage Patch’ (GPGP). As shown in the chart above, the largest accumulation of plastics within ocean basins is the North Pacific. This results from the combined impact of large coastal plastic inputs in the region, alongside intensive fishing activity in the Pacific ocean.
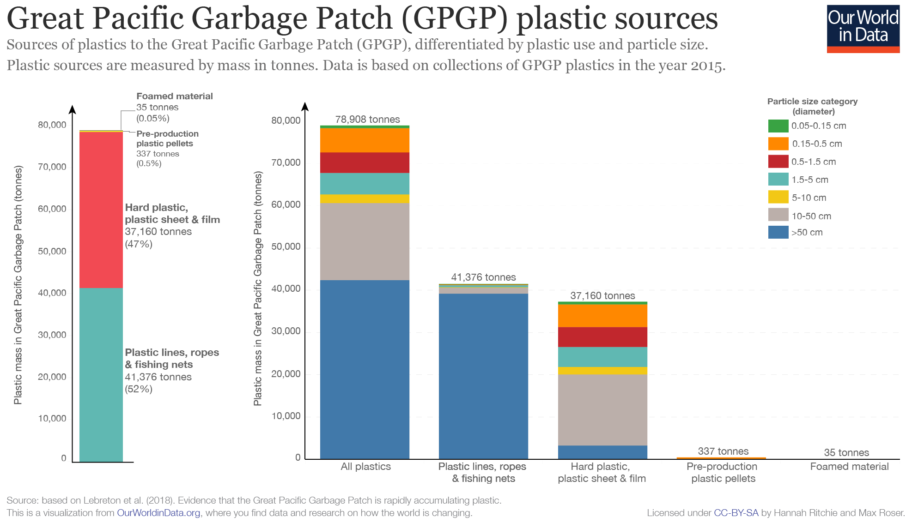
In a Nature study, Lebreton et al. (2018) attempted to quantify the characteristics of the GPGP. The vast majority of GPGP material is plastics — trawling samples indicate an estimated 99.9 percent of all floating debris. The authors estimate the GPGP spanned 1.6 million km2. This is just over three times the area of Spain, and slightly larger in area to Alaska (the USA’s largest state). The GPGP comprised 1.8 trillion pieces of plastic, with a mass of 79,000 tonnes (approximately 29 percent of the 269,000 tonnes in the world’s surface oceans). Over recent decades, the authors report there has been an exponential increase in the concentration of surface plastics in the GPGP.
In the chart above we see the estimated composition of the GPGP plastic. Around 52 percent of plastics originated from fishing activity and included fishing lines, nets and ropes; a further 47 percent was sourced from hard plastics, sheets and films; and the remaining components were small in comparison (just under one percent). The dominance of fishing lines, nets, hard plastics and films means that most of the mass in the GPGP had a large particle size (meso- and macroplastics).

